This page is provided to show the massive potential of this new Pool Throwing Unit (PTU) solution compared with the 2017 Tubbs fire. Though the examples on this page are hypothetical, they do show the game changing possibilities. Of course the actual response would’ve been dependent on a number of variables. The main point is to show this PTU solution would’ve provided firefighters with the ability to get a lot more water on the fire faster.
The Tubbs fire currently ranks as the 2nd most destructive wildfire in Californica history. This fast moving wildfire destroyed 5636 structures in and around Santa Rosa, CA.
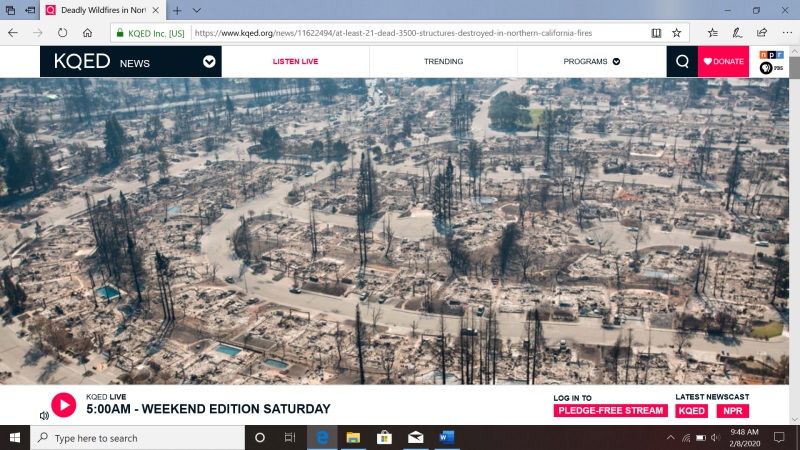
This news story screenshot image shows the devastated area of Coffee Park. It should be pretty obvious that neighborhood fire hydrant networks are not designed to protect homes from these massive wind driven firestorms.
Before reaching Coffee Park, the Tubbs Fire destroyed 1000’s of other structures. It took less than 4 hours from ignition to reach the outer edges of Santa Rosa. Was there really anything that could’ve been done? See the Google Satellite image below.
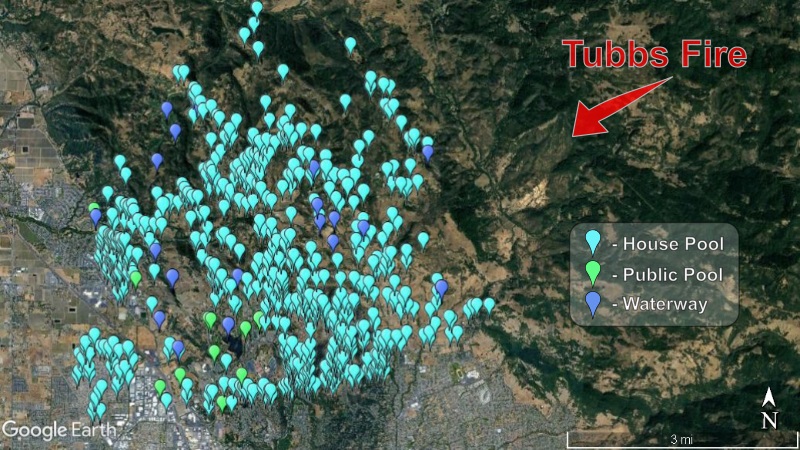
There were over 700 swimming pools and 40+ waterways along this fires path of destruction. The map image above shows those in and around the city limits of Santa Rosa.
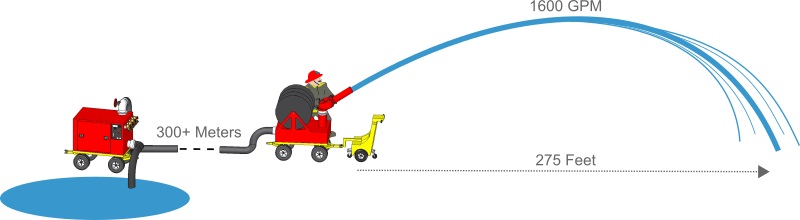
Considering the high fire risk, let’s assume the city of Santa Rosa owned at least 60 monitor placement PTU’s pictured below and had plans in place for their use.
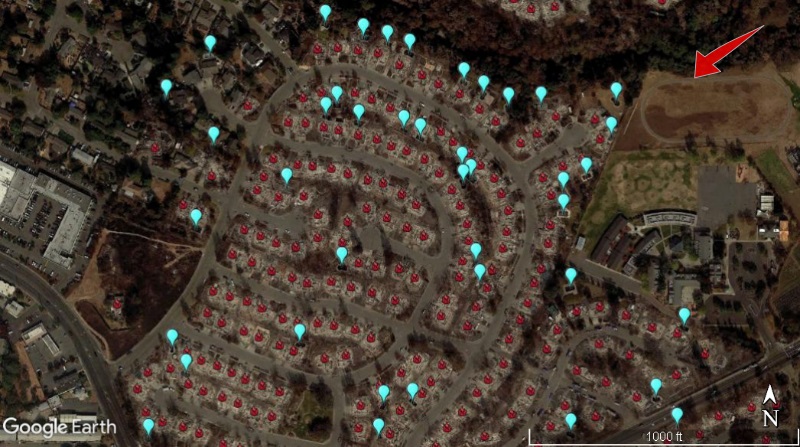
The Tubbs fire started at 9:42 P.M. Firefighters started issuing the first evacuation orders a little before 11 PM for this fast moving fire. They issued a warning at 1:12 AM that the fire would reach the eastern portion of Santa Rosa within an hour. There was more than enough time to get systems in place. A crew of 10 could easily deploy all 60 systems in under 45 minutes. Considering how dangerous this fire was, these systems could’ve been left unmanned to operate remotely. See the zoomed in Google Satellite image below showing the eastern portion of Santa Rosa.
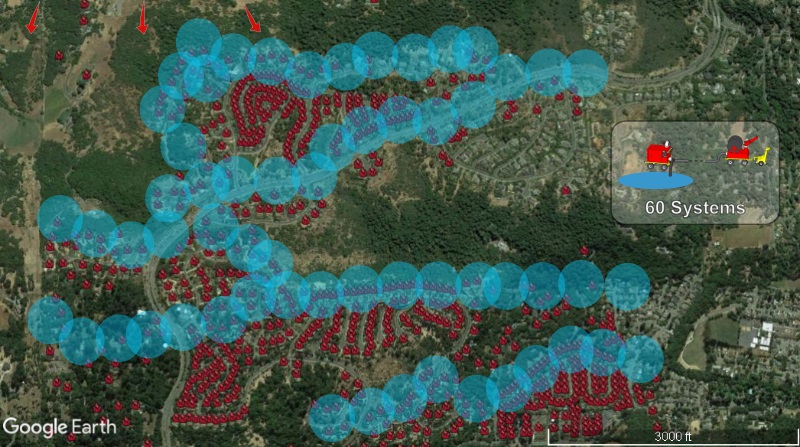
The red markers show where over 700 homes were destroyed while approximately 150 pools sat full shown by the blue markers. That’s nearly 3 million gallons of water spread throughout these streets. Now see the Google Satellite image below.
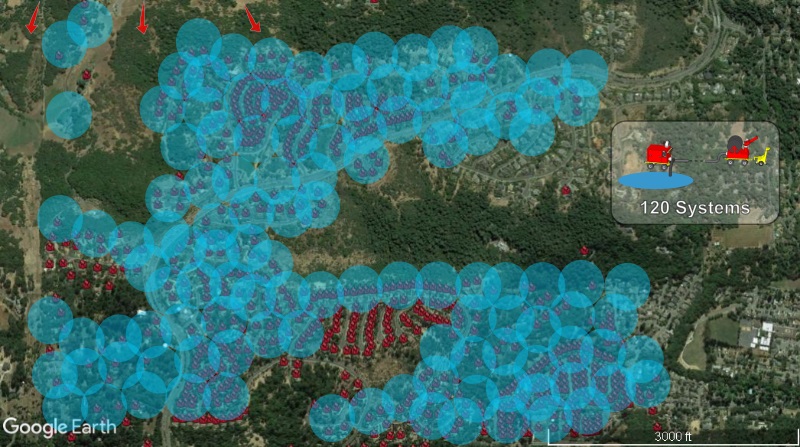
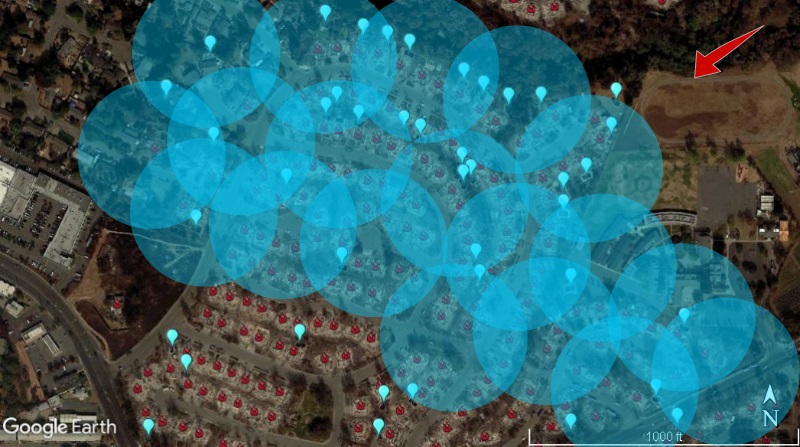
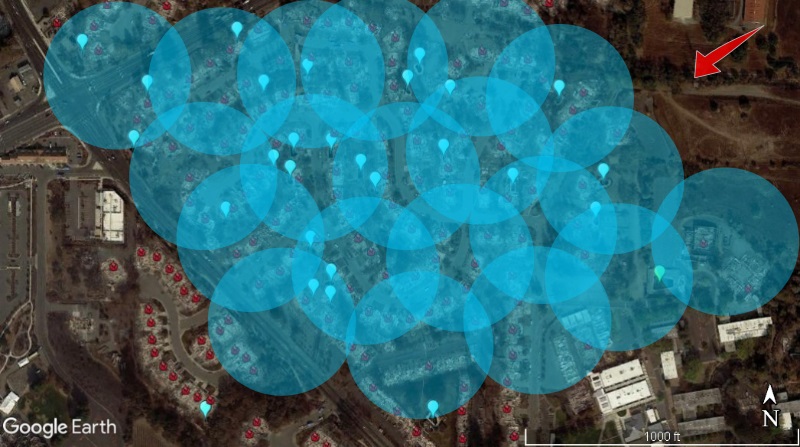
The overlapped blue circles represent the outputs of 60 monitor placement PTU’s. At full operation they would produce a whopping 96,000 gallons per minute. These big walls of water would’ve created multiple fire breaks over 1.5 miles wide. The red arrows in the upper left show the approximate direction of the fire.
This firestorm was pushed by very high winds and maybe you question if this would’ve been enough? There were 150 pools available along these streets. See the Google Satellite image below.
If 60 more PTU’s arrived from other locations, more of these pools could’ve been put to use. The blue circles represent the outputs of 120 PTU’s. They would’ve produced 192,000 gallons per minute with even more coverage. A crew of 20 could’ve deployed all of these systems in under 45 minutes. With the ability to produce 2.4 million gallons of water in under 13 minutes, these homes and many others likely could’ve been saved. There was a lot more destruction further along the path of this fire.
See the Google satellite image below.
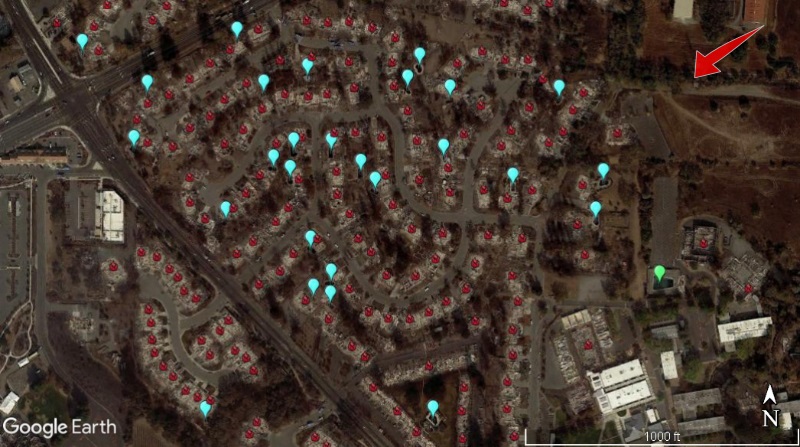
This image shows another neighborhood west of the previous example with nearly 200 homes destroyed while 40+ pools sat full. That’s around 700,000 gallons of water that could’ve been used. See the Google Satellite image below.
The blue circles represent the outputs of just 20 monitor placement PTU’s paired with less than half of the pools here. At full operation they would’ve produced 32,000 gallons per minute with sizeable overlap. These PTU’s could’ve been operated remotely and cycled on shortly before the fire arrived to pre-soak all the homes. If this line of protection would’ve been created, the results likely would’ve been much different
See the Google satellite image below for another example.
This image shows another neighborhood just south of the previous one with 150+ homes destroyed while 27 pools and a large community pool sat full. That’s around 600,000 gallons of water that could’ve been used. See the Google Satellite image below.
The blue circles represent the outputs of just 20 monitor placement PTU’s paired with pools here. At full operation they would’ve produced 32,000 gallons per minute with sizeable overlap. These PTU’s could’ve been operated remotely and cycled on shortly before the fire arrived to pre-soak the homes. If this line of protection would’ve been created, many of these homes likely could’ve been saved. So many more examples like this can be shown for the Tubbs Fire. Homes should not burn while pools sit full.
As with all wildfires, fire crews used all the possible assets for the best possible outcome during the Tubbs fire. No matter how many firetrucks you have, flow rates are still limited by the water main size feeding the hydrants. These hydrant networks are not designed to defend against massive wildfires. A typical neighborhood will be fed by a 6, 8, 10, or 12 inch main. The maximum flow rates will be capped at approximately 800, 1600, 3000, and 4700 GPM respectively. Again, the examples provided on this page are hypothetical but do show the massive potential of this new PTU solution. Throughout many of the areas of destruction from the Tubbs fire, it would’ve been possible to create flow rates of 10, 20, 50 and even 100+ times greater than local hydrant networks. Firefighters could’ve literally made it rain!